Air quality in the USA, 2005 - stock video
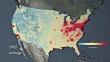
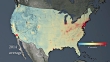
Air quality in the United States. Map of the United States showing changes in average atmospheric nitrogen dioxide (NO2) concentrations between 2005 and 2014, followed by a trend map of decreases in NO2 concentration. Nitrogen dioxide gas is a common emission from vehicles, power plants and industry, and is used as an indicator of general air quality. The decreases are a result of emission control regulations. Data obtained by the Ozone Monitoring Instrument aboard NASA's Aura satellite.


PURCHASE A LICENSE
All Royalty-Free licenses include global use rights, comprehensive protection, simple pricing with volume discounts available
$575.00
CAD
DETAILS
Credit:
Creative #:
893033092
License type:
Collection:
Verve+
Max file size:
1920 x 1080 px - 462 MB
Clip length:
00:00:15:00
Upload date:
Location:
United Kingdom
Release info:
No release required
Mastered to:
QuickTime 8-bit Photo-JPEG HD 1920x1080 25p
Categories:
- USA,
- Map,
- Greenhouse Gas,
- Pollution,
- Air Pollution,
- Satellite,
- Satellite View,
- 10 Seconds or Greater,
- 2005,
- 21st Century,
- Atmosphere,
- Aura,
- Change,
- City,
- Color Coded,
- Color Image,
- Concentration,
- Control,
- Emitting,
- Environment,
- Environmental science,
- Film - Moving Image,
- Gas,
- Global,
- HD Format,
- Horizontal,
- Improvement,
- No People,
- North America,
- Ozone Layer,
- Physical Geography,
- Planet Earth,
- Real Time Video,
- Reduction,
- Smog,
- Social Issues,
- Surveillance,
- UK,
- Variation,
- Wind,
- Zoom Effect,